S&P Global: A market-leading company with a large moat
- Glenn
- Aug 12, 2023
- 23 min read
Updated: Feb 17
S&P Global plays an important role in global financial markets by providing credit ratings, market benchmarks, and data used by investors, companies, and governments. From well known indices like the S&P 500 to tools that help professionals analyze risk and make decisions, the company earns recurring revenue by supplying information markets rely on every day. After integrating IHS Markit and expanding into areas such as private markets and energy analytics, S&P Global aims to stay relevant as finance becomes more complex and data driven. The question remains: Does S&P Global deserve a place in your portfolio?
This is not a financial advice. I am not a financial advisor and I only do these post in order to do my own analysis and elaborate about my decisions, especially for my copiers and followers. If you consider investing in any of the ideas I present, you should do your own research or contact a professional financial advisor, as all investing comes with a risk of losing money. You are also more than welcome to copy me.
For full disclosure, I should mention that I do not own any shares in S&P Global at the time of writing this analysis. If you would like to copy or view my portfolio, you can find instructions on how to do so here. If you want to purchase shares or fractional shares of S&P Global, you can do so through eToro. eToro is a highly user-friendly platform that allows you to get started on investing with as little as $50.
The Business
S&P Global is a global provider of financial intelligence that supplies data, benchmarks, and analytical tools used to support decision-making across capital markets, commodity markets, and corporations. Rather than taking financial risk itself, the company functions as infrastructure that improves transparency and risk assessment, allowing markets to operate more efficiently. Its activities span five main segments that together generate revenue from recurring subscriptions, asset-linked fees, and transaction-based services. The Ratings division evaluates the creditworthiness of governments, corporations, and structured finance products. These opinions determine borrowing costs and access to capital, making the service deeply embedded in global debt markets. Revenue is earned when debt is issued and from ongoing monitoring of outstanding securities. Market Intelligence provides financial data platforms, research, and workflow software used by investors, banks, companies, and public institutions for valuation, risk management, and investment analysis. These tools are integrated into daily operations, which leads to highly recurring subscription revenue. The S&P Dow Jones Indices segment maintains widely used benchmarks such as the S&P 500 and the Dow Jones Industrial Average and earns licensing fees whenever assets track those indices through ETFs, mutual funds, or derivatives. Commodity Insights delivers price benchmarks and analytics used in contracts across energy, metals, agriculture, and shipping markets, meaning customers depend on the data for settlement and risk management. The Mobility business supplies automotive industry data and forecasts and is planned to be separated to sharpen the company’s focus on financial information services. The company’s competitive moat is built on regulatory embeddedness, network effects, proprietary data, and long-standing trust that together embed its services into the functioning of financial markets. In credit ratings, regulations and investment mandates often require securities to be rated by recognized agencies, effectively creating a legal barrier to entry and supporting a market structure dominated by S&P Global and Moody’s. In indices, a powerful network effect exists where investors measure performance against the benchmark, funds track it, and derivatives reference it, reinforcing the importance of the same index over time and creating stable asset-linked revenue. The firm also owns extensive proprietary datasets accumulated over decades across credit, commodities, and financial markets. These datasets are essential for risk models, regulatory reporting, and increasingly for artificial intelligence applications, making them difficult to replicate. Finally, trust and reputation form a significant barrier because financial markets rely on widely accepted standards, and credibility built over more than a century cannot easily be replaced. Together these advantages mean the company does not merely compete for customers each year but operates as a core part of the financial system. Regulation requires its ratings, investment products depend on its benchmarks, contracts reference its prices, and daily workflows rely on its data, creating durable demand and resilient long-term profitability.
Management
Martina L. Cheung serves as the CEO of S&P Global, a position she assumed on November 1, 2024. She joined the company in 2010 as Vice President of Operations for S&P Global Ratings and has since held a wide range of leadership roles across the organization, giving her unusually broad exposure to nearly all of the company’s business lines. Over time she served as Chief Strategy Officer and Head of Risk Services for S&P Global Market Intelligence, became President of S&P Global Market Intelligence in 2019, and later led S&P Global Ratings. She also acted as Executive Lead of Sustainable1, the company’s ESG and sustainability data platform, reflecting her involvement in shaping newer product areas as well as the legacy franchise. Prior to joining S&P Global, Martina L. Cheung worked in consulting, first in Accenture’s Financial Services Strategy group and later as a Partner at Mitchell Madison Consulting, where she advised financial institutions on strategy and operational transformation. She holds a bachelor’s degree in commerce and a master’s degree in business studies from the National University of Ireland, Galway. Over the course of her career she has been recognized within the financial industry, including being named one of the Most Powerful Women in Finance by American Banker and appearing on Pensions and Investments’ list of Influential Women in Institutional Investing. INvolve also included her in its 100 Empower Executives list. Since becoming CEO, Martina L. Cheung has focused heavily on customer engagement and internal integration. Shortly after taking the role she conducted more than one hundred meetings with major clients and stakeholders to strengthen executive level relationships and better align the company’s products with customer workflows. Her strategic priorities center on simplifying the organization, aligning go to market efforts across divisions, and removing internal silos so that datasets, benchmarks, and analytics can be combined into more comprehensive solutions. This approach reflects the nature of S&P Global’s business model, where value increasingly comes from linking proprietary data across segments rather than operating each unit independently. Because Martina L. Cheung spent over a decade inside the company across both Ratings and Market Intelligence, she combines institutional knowledge with operational experience in subscription software, data products, and regulated financial services. Her background suggests a leadership style oriented toward collaboration, integration, and long term product development rather than short term financial engineering. Given her deep familiarity with the company’s core franchises and her focus on strengthening customer workflows and innovation, I believe Martina L. Cheung is well positioned to guide S&P Global through its next phase of growth.
The Numbers
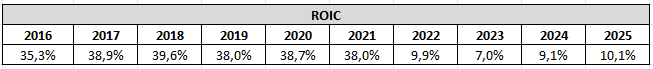
The first number we will look into is the return on invested capital, also known as ROIC. We want to see a 10-year history, with all numbers exceeding 10% in each year. The ROIC dropped sharply from around 35 to 40% before 2022 to roughly 7 to 10% afterward. At first glance this looks like the business suddenly became much weaker, but the change is mainly explained by the large acquisition the company completed in 2022 rather than by a deterioration in its economics. In 2022, S&P Global acquired IHS Markit in a transaction valued at about 44 billion dollars. When a company buys another company, the purchase price is added to the amount of capital the business is considered to use. That increase happens immediately, while the earnings from the acquired business improve only gradually over several years as products are combined and customers adopt the new offerings. Because ROIC compares profit to the capital employed, the result automatically falls right after a major deal even if the underlying business remains strong. The timing matches perfectly, as returns were still high before the acquisition and dropped right after it closed. Returns also stayed lower in the following years because the benefits of the acquisition take time to appear in the numbers. Integrating large data platforms does not happen overnight. The strategy is to connect datasets across ratings, indices, commodity data, and analytics tools so customers can use them together, but customers adopt these combined solutions step by step. In addition, accounting rules require part of the purchase price to be spread as expenses over many years, which lowers reported profits even though it does not affect cash generation. Economically the company likely became broader and more integrated rather than fundamentally different. Before the acquisition S&P Global already generated significant recurring revenue from data, benchmarks, and analytics. The IHS Markit acquisition greatly expanded the depth of its datasets, particularly in derivatives, supply chains, and energy markets, allowing the company to combine multiple data sources into unified workflows. The strategic goal was not to change the type of business, but to strengthen switching costs and cross selling opportunities by embedding more products into customer processes. So the key point is not transformation but reinforcement of the moat. The company moved from a strong data provider to a much larger platform with more opportunities to bundle products together, which should improve pricing power and retention over time rather than immediately boosting returns. The recent movement upward from around 7% to above 10% suggests this process has already started. Future improvement should come from selling integrated datasets across divisions, applying artificial intelligence to proprietary data, and separating the Mobility division, which should reduce the capital tied up in the business. The company will probably not return to forty percent returns because it now operates on a larger capital base, but a level around 15 to 25% would still indicate a very high quality business. The decline therefore reflects accounting effects from the acquisition rather than a weakening of the company, and a gradual increase in returns over the coming years would show that the strategy is working.
The next numbers are the book value + dividend. In my old format this was known as the equity growth rate. It was the most important of the four growth rates I used to use in my analyses, which is why I will continue to use it moving forward. As you are used to see the numbers in percentage, I have decided to share both the numbers and the percentage growth year over year. To put it simply, equity is the part of the company that belongs to its shareholders – like the portion of a house you truly own after paying off part of the mortgage. Growing equity over time means the company is becoming more valuable for its owners. So, when we track book value plus dividends, we’re essentially looking at how much value is being built for shareholders year after year. The change in equity is mainly explained by the 2022 acquisition of IHS Markit by S&P Global rather than by normal business performance. To complete the deal, S&P Global issued a large number of new shares to the former owners of IHS Markit. When a company pays with shares, total equity increases immediately because the company now belongs to more shareholders. This means the balance sheet became much larger in 2022 even though the increase did not come from profits earned that year. It was essentially a one time step up caused by the transaction. After such a jump, equity usually returns to growing in a more normal way. For S&P Global, the business generates strong free cash flow and does not require much capital to operate, so profits that remain in the company gradually add to equity over time. In the future, equity will most likely grow steadily and predictably, mainly following earnings growth rather than showing another large jump.

Finally, we will analyze the free cash flow. Free cash flow, in short, refers to the cash that a company generates after covering its operating expenses and capital expenditures. I use levered free cash flow margin because I believe that margins offer a better understanding of the numbers. Free cash flow yield refers to the amount of free cash flow per share that a company is expected to generate in relation to its market value per share. S&P Global has historically generated very strong free cash flow and high free cash flow margins, which is typical for a business built on data, benchmarks, and software rather than physical assets. Most of the company’s costs are employees, technology, and data collection, while ongoing capital investment needs are limited. Once datasets and platforms are built, selling an additional subscription or licensing an index requires very little extra cost, which allows a large share of revenue to turn into cash. The temporary drop in free cash flow and margins around 2022 is largely explained by the integration of IHS Markit. Integration expenses, restructuring costs, and duplicated systems reduced margins in the short term. As those costs faded and the businesses were combined, free cash flow quickly recovered and margins moved back toward historical levels. The rebound in the following years suggests the underlying economics of the business remained intact. Going forward, free cash flow is likely to grow over time. The company benefits from recurring subscription revenue, index licensing fees tied to assets under management, and pricing power on proprietary data. Growth should come from cross selling datasets across divisions, embedding products deeper into customer workflows, and layering analytics and artificial intelligence tools on top of existing data. Because the business requires little incremental capital, additional revenue tends to translate efficiently into additional cash flow. The company uses its free cash flow in a fairly structured way. A large portion is returned to shareholders through share repurchases and a steadily growing dividend, with management targeting the majority of annual free cash flow for capital returns. At the same time, the company reinvests in growth by funding product development, integrating platforms, and completing smaller complementary acquisitions that expand datasets and capabilities. In practice this means cash flow supports three purposes simultaneously: maintaining shareholder returns, investing in organic growth, and selectively acquiring additional data assets to strengthen the long term competitive position. The free cash flow yield is at its highest level since 2018, which indicates that while the shares are not necessarily cheap, they are trading at one of their more attractive valuations in many years. However, we will revisit valuation later in the analysis.

Debt
Another important aspect to consider is the level of debt. It is crucial to determine whether a business has manageable debt that can be repaid within a three year period. This is calculated by dividing total long term debt by earnings. After performing this calculation for S&P Global, I found that the company has 2,79 years of earnings in debt. This falls below the three year threshold, indicating that debt would not be a concern for me if I were to invest in S&P Global. It is also worth noting that the relatively high debt level is primarily due to the acquisition of IHS Markit. The company could have reduced its debt more quickly had it not prioritized returning most of its free cash flow to investors. Given the recurring nature of its subscription and licensing revenue, the company’s earnings are relatively stable, which further supports the view that the debt level is manageable. Over time, as earnings grow and integration synergies materialize, leverage should gradually decline even without aggressive debt repayment.
Unlock Exclusive Seeking Alpha Discounts – Level Up Your Investing With Zero Risk
If you’ve been thinking about improving your investing process, this is the easiest way to start. These offers are only available through my links, and the Premium plan even comes with a 100% risk-free 7-day trial. Try everything for a week, and if it’s not for you, just cancel. You lose nothing.
1) Seeking Alpha Premium — Try It Free for 7 Days
Access the tools I personally use every day:
• Earnings transcripts
• Stock screeners
• Deep-dive analysis
• Portfolio tracking
• Market news with context that actually matters
Special Price: $269/year (normally $299) + 7-day free trial (for new users only)
Try Premium Free for 7 Days → HERE
(Explore everything — cancel anytime during the trial and pay $0.)
2) Alpha Picks — Proven Stock Ideas
This stock-picking service has delivered +287% returns vs. the S&P 500’s +77% (July 2022–Nov 2025).Great for investors who want curated, long-term picks backed by data.
Special Price: $449/year (normally $499)
Get Alpha Picks → HERE
(Although Alpha Picks doesn’t offer a free trial, its historical outperformance means the subscription can often pay for itself quickly if results persist. For many investors, the potential return far outweighs the upfront cost).
3) Premium + Alpha Picks Bundle — Best Value
Get both services together and save $159.Perfect if you want both broad tools and high-conviction stock ideas.
Special Price: $639/year (normally $798)
Get the Bundle → HERE
(This bundle doesn’t include a free trial, but it gives you both services at a $159 discount. You get Premium’s in-depth research plus Alpha Picks’ high-performing recommendations, making it the most comprehensive option for serious investors.)
Risks
Competition is a risk for S&P Global because the value of financial data and analytics increasingly depends not only on proprietary information but also on how easily competitors can replicate insights using technology, alternative data, and artificial intelligence. One pressure comes from the growing availability of public and low cost information. Over time, financial statements, macroeconomic data, company filings, satellite data, and market statistics have become widely accessible through the internet and cloud infrastructure. Artificial intelligence accelerates this trend by allowing users to collect, structure, and analyze large datasets at very low cost. This means smaller firms, individual analysts, and cost conscious organizations can increasingly perform basic analysis without paying for premium platforms. While this does not replace the deepest datasets, it can reduce demand at the lower end of the customer base and increase pricing pressure in the Market Intelligence segment. S&P Global also competes directly with large established providers such as Bloomberg, FactSet, and Refinitiv, which offer similar workflow tools and financial databases. Because these services are embedded in daily workflows, customers rarely use only one provider and often negotiate pricing aggressively. As financial institutions focus on efficiency and cost reduction, they are more willing to question the number of terminals, datasets, and subscriptions they maintain. This creates ongoing pressure on pricing and contract renewals, particularly when competitors bundle services or offer discounts to gain share. Artificial intelligence intensifies competition further. New entrants can now build analytics products without collecting decades of data themselves by using public information combined with machine learning models. Larger competitors are also investing heavily in AI driven research tools, automation, and predictive analytics. If these tools can generate insights comparable to proprietary datasets, parts of the company’s offering could become less differentiated, reducing pricing power. There is also a risk that customers use AI tools on top of publicly available data to internally replicate certain analyses that were previously purchased externally. Another risk comes from the protection of proprietary data. If clients or competitors use artificial intelligence systems trained on S&P Global’s information to create competing insights, the uniqueness of its datasets could be diluted. The challenge is balancing customer usability with preventing data leakage, which becomes harder as AI models can learn patterns from large datasets and reproduce similar outputs.
Lower market volume is a risk for S&P Global because a meaningful share of its revenue is tied to financial activity rather than just the passage of time. Although much of the company’s business is subscription based, several important products depend directly on how active capital markets and commodity markets are. The most cyclical area is the Ratings segment. Companies and governments need a credit rating when they issue new debt, so the number of bonds issued largely determines demand. When interest rates rise, credit spreads widen, or economic uncertainty increases, borrowers often delay financing, acquisitions, and expansion plans. That immediately reduces the number of new bonds entering the market and therefore reduces rating fees. A prolonged period of high rates or weak economic growth can lead to several quarters of lower issuance, which historically has been the main driver of earnings volatility for the company. The Indices segment is affected in a different way. S&P Global earns fees tied to assets invested in products that track its indices, such as ETFs, mutual funds, and derivatives. During market downturns, falling asset prices reduce the value of assets linked to the indices, which lowers revenue even if investors do not withdraw money. In addition, cautious investors may allocate less capital to markets during uncertain periods, further limiting growth in index related fees. Some trading related products can benefit from volatility, but sustained weak markets generally reduce overall asset levels and therefore reduce fee growth. Market Intelligence and Commodity Insights also feel the impact of slower activity. Financial institutions often review expenses during weak markets and may cut discretionary spending on data, analytics tools, and consulting services. At the same time, reduced dealmaking, trading, and investment activity lowers the urgency for certain datasets and workflow solutions. In commodity markets, lower trading activity or disruptions such as sanctions can reduce demand for price assessments and transaction related services even if subscription revenue remains relatively stable.
Cyber attacks are a risk for S&P Global because the company operates as part of the infrastructure of global financial markets and relies almost entirely on trust, data integrity, and uninterrupted access to its systems. A large portion of the company’s value comes from handling sensitive information. Credit ratings, research, benchmark methodologies, and corporate disclosures often contain confidential material about companies, governments, and financial transactions before that information becomes public. If attackers gained access to such data, it could be used for insider trading, market manipulation, or corporate espionage. Even if the direct financial damage were limited, the loss of confidence from clients and regulators could be severe, since customers rely on the company specifically because it is trusted to handle sensitive information securely. The company is also a visible target due to its influence on markets. Its ratings affect borrowing costs, its indices determine investment allocations, and its commodity price benchmarks are used in contracts around the world. That makes it attractive not only to financially motivated hackers but also to state sponsored actors attempting to disrupt markets or obtain strategic information. A successful attack could interfere with the publication of ratings, delay benchmark calculations, or disrupt data distribution platforms, which could temporarily affect trading and settlement processes across financial markets. Operational disruption is another important risk. The business depends on continuous digital delivery of data and analytics. A ransomware attack or denial of service incident could make platforms unavailable to banks, asset managers, and corporations that rely on them daily. Even a short outage during market hours could create contractual liabilities, regulatory scrutiny, and reputational damage. Because many customers integrate S&P Global data directly into automated workflows, reliability is nearly as important as accuracy. Artificial intelligence adds another dimension to the risk. AI systems require large datasets and complex infrastructure, increasing the number of access points and the potential consequences of a breach. At the same time, attackers can use AI to launch more convincing phishing attempts or automated intrusion campaigns. There is also the risk that proprietary data could be extracted and used to train competing models, weakening the uniqueness of the company’s datasets.
Reasons to invest
Secular growth trends is a reason to invest in S&P Global because the company operates in areas of finance that tend to expand over decades rather than just economic cycles, allowing its revenue base to grow alongside the size and complexity of global markets. One important driver is the long term expansion of capital markets. As economies grow and financial systems develop, companies and governments increasingly finance themselves through bonds rather than bank loans. The total amount of debt outstanding globally has risen steadily for decades and generally grows with economic output. Every new bond issuance and refinancing requires a credit rating, and even existing debt must be monitored over time. This creates a structural tailwind for the Ratings segment that does not depend solely on short term market conditions. The development of emerging markets further strengthens this trend, as countries in Asia, the Middle East, and other regions continue building modern capital markets and therefore require recognized ratings and risk assessments. Another powerful trend is the global shift from active to passive investing. More money is being invested in funds that track indices instead of funds that attempt to beat the market. Because the company owns widely used benchmarks such as the S&P 500, it earns fees whenever assets track those indices. As assets under management increase and passive products spread internationally and across asset classes, revenue grows without requiring additional capital. The steady increase in assets benchmarked to its indices illustrates a structural shift in how people invest rather than a temporary market phenomenon. Finance is also becoming more data driven. Institutions must process large amounts of information to evaluate risk, comply with regulation, and allocate capital. Raw public data is abundant, but decision makers increasingly need curated, standardized, and reliable datasets integrated into their workflows. This plays directly to the company’s strengths because its products transform complex information into usable insights. The acquisition of IHS Markit expanded the breadth of available data, enabling customers to combine financial, economic, and industry information in a single platform and making the service more embedded in daily decision making. Additional long term drivers include ongoing refinancing needs as existing debt matures, increasing regulatory requirements for transparency and reporting, and growing investment in areas such as infrastructure, energy transition, and artificial intelligence, all of which require financing and therefore ratings, benchmarks, and analytics. The company also benefits from expanding geographic coverage as more regions adopt global financial standards and integrate into international capital markets.
New markets is a reason to invest in S&P Global because the company is expanding beyond its traditional public market activities into areas of finance that are growing faster than the overall economy and that still lack standardized data, benchmarks, and risk assessment. One of the most important opportunities is private markets. A growing share of companies now remain private for longer and raise capital through private equity, private credit, and asset based financing instead of public exchanges. Assets in private markets have been increasing faster than traditional public assets, and institutional investors such as pension funds and sovereign wealth funds are allocating more capital to them. These markets historically lacked transparency and standardized reporting, which creates demand for independent benchmarks, ratings, and analytics. By building private market ratings, benchmarks, and analytics platforms and strengthening datasets through acquisitions and partnerships, the company is positioning itself to become infrastructure for this part of finance just as it already is in public markets. Another expanding area is the energy ecosystem. The global shift toward electrification, renewable power, and more complex supply chains is not replacing traditional energy sources but adding layers of complexity. Energy markets now require forecasting, pricing benchmarks, and risk analysis across power grids, commodities, and industrial inputs such as metals and chemicals. As investment flows into energy infrastructure and transition projects, the need for standardized data and credit assessment grows. Because the company already provides commodity benchmarks and credit ratings, it can extend those capabilities into new parts of the value chain and connect energy data with financial risk analysis. The company is also moving into decentralized finance and tokenized assets. Digital assets, stablecoins, and blockchain based financial infrastructure still lack trusted risk assessment and widely accepted benchmarks. By developing stability assessments, ratings methodologies, and even on chain indices, the company aims to play the same role in digital markets that it plays in traditional capital markets. If these markets mature and become more regulated, participants will likely require independent verification and standardized benchmarks, which fits the company’s expertise.
Organizational integration and shared data infrastructure is a reason to invest in S&P Global because the company is increasingly operating as one connected platform rather than a collection of separate products, which strengthens customer dependence and improves efficiency. Historically, the company’s divisions such as ratings, indices, commodity data, and analytics were valuable on their own, but customers often interacted with them separately. The company is now actively linking these products together through a centralized data organization and a unified client engagement structure. By combining datasets and delivering them through common platforms, customers can use multiple services inside the same workflow. This makes the offering more useful while also increasing switching costs, since replacing a single product becomes difficult when it is embedded in a broader system. The company’s central data organization is focused on collecting, standardizing, and distributing information across all divisions. This allows the same underlying dataset to power several products at once, improving scalability. Instead of each business maintaining separate systems, shared infrastructure reduces duplication and lowers operating costs. Automation and artificial intelligence are also being used to process data faster and with less manual work, which both improves margins and allows new products to be developed more quickly. The company has also created a centralized client relationship structure that works directly with senior decision makers at large customers. Rather than selling individual services, it now presents a combined solution spanning risk analysis, benchmarks, and analytics. By collaborating with customers’ technology and data teams, it can develop solutions that solve real operational problems and then sell similar products across its broader client base. This deepens relationships and embeds the company into customer operations, making revenue more durable. These changes also accelerate growth after acquisitions. When new datasets are purchased, they can be integrated quickly into existing platforms and distributed to a large customer base. This shortens the time between acquiring data and generating revenue from it, improving returns on investment.
Support the Blog
I want to keep the blog free and accessible for everyone. If you enjoy the content and would like to support it, you can buy me a cup of coffee through PayPal. Every little bit helps and is truly appreciated!

Valuation
Now it is time to calculate the share price. I perform three different calculations that I learned at a Phil Town seminar. If you want to make the calculations yourself for this or other stocks, you can do so through the tools page on my website, where you have access to all three calculators for free.
The first is called the Margin of Safety price, which is calculated based on earnings per share (EPS), estimated future EPS growth, and estimated future price-to-earnings ratio (P/E). The minimum acceptable rate of return is 15%. I chose to use an EPS of 14,66, which is from the year 2025. I have selected a projected future EPS growth rate of 13%. Finbox expects EPS to grow by 12,9% in the next five years. Additionally, I have selected a projected future P/E ratio of 26, which is twice the growth rate. This decision is based on S&P Global's historically higher price-to-earnings (P/E) ratio. Finally, our minimum acceptable rate of return has already been established at 15%. After performing the calculations, we determined the sticker price (also known as fair value or intrinsic value) to be $320,04. We want to have a margin of safety of 50%, so we will divide it by 2. This means that we want to buy S&P Global at a price of $160,02 (or lower, obviously) if we use the Margin of Safety price.
The second calculation is known as the Ten Cap price. The rate of return that a company owner (or stockholder) receives on the purchase price of the company essentially represents its return on investment. The minimum annual return should be at least 10%, which I calculate as follows: The operating cash flow last year was 5.650, and capital expenditures were 195. I attempted to analyze their annual report to calculate the percentage of capital expenditures allocated to maintenance. I couldn't find it, but as a rule of thumb, you can expect that 70% of the capital expenditures will be allocated to maintenance purposes. This means that we will use 137 in our calculations. The tax provision was 1.407. We have 302,8 outstanding shares. Hence, the calculation will be as follows: (5.650 – 137 + 1.407) / 302,8 x 10 = $228,53 in Ten Cap price.
The final calculation is referred to as the Payback Time price. It is a calculation based on the free cash flow per share. With S&P Global's free cash flow per share at $18,02 and a growth rate of 13%, if you want to recoup your investment in 8 years, the Payback Time price is $259,77.
Conclusion
S&P Global is an intriguing company with strong management. It has built its moat on regulatory embeddedness, network effects, proprietary data, and long standing trust that together integrate its services into the functioning of financial markets. The company historically achieved very high ROIC before the acquisition of IHS Markit, after which returns declined but are expected to gradually recover and settle somewhere between 15 and 25%. Free cash flow reached its second highest level ever in 2025 and is expected to grow over time. Competition is a risk for S&P Global because advances in technology and artificial intelligence make it easier for customers and rivals to generate financial insights using public or lower cost data, which can pressure demand and pricing for its analytics products, while large competitors and new AI driven entrants offer similar workflow tools and bundled services that may reduce differentiation. Lower market volume is also a risk because parts of revenue depend on financial activity such as debt issuance, asset values, and trading levels, meaning that when markets slow due to high interest rates or economic uncertainty fewer bonds are issued, index linked assets decline, and customers reduce spending on data and analytics, temporarily pressuring growth and earnings. Cyber attacks are another risk since the company handles sensitive financial data and relies on constant availability and trust, so a breach or outage could disrupt critical services, damage its reputation, and lead to regulatory consequences or lost customers. Secular growth trends support the investment case because the business benefits from long term expansion in capital markets, the shift toward passive investing, and increasing demand for data driven decision making, which drives growing usage of its ratings, benchmarks, and analytics over time. Expansion into new markets also strengthens the outlook as the company applies its expertise to private markets, energy transition, and digital assets where standardization is still developing, creating additional long term growth opportunities. Organizational integration and shared data infrastructure further improve the thesis because the company is evolving into a unified platform that embeds multiple services into customer workflows, raising switching costs while improving efficiency and scalability. I believe that S&P Global is a great company and buying shares at the intrinsic value from the Margin of Safety calculation of $320 would be a good long term investment.
My personal goal with investing is financial freedom. It also means that to obtain that, I do different things to build my wealth. If you have some extra hours to spare each month, you can turn a few hours a week into a substantial amount of money in a few years. If you are interested to know how I do it, you can read this post.
I hope you enjoyed my analysis! While I can’t post about every company I analyze, you can stay updated on my trades by following me on Twitter. I share real-time updates whenever I buy or sell, so if you’re making your own investment decisions, be sure to follow along!
Some of the greatest investors in the world believe in karma, and to receive, you will have to give (Warren Buffett and Mohnish Pabrai are great examples). If you appreciated my analysis and want to get some good karma, I would kindly ask you to donate a bit to 10.000 dogs. They rescue street dogs in Thailand by giving them food, medicine and vet care. If you have a little to spare, please donate here. Even a little will make a huge difference to save these wonderful animals. Thank you.


Comments